What's the Payback Period for Plug-in Solar?
Most plug-in solar systems reach their payback period in three to five years. How fast that happens depends on two things: what you paid for the system, and what you're currently paying per kilowatt-hour. In California or New York (where rates top $0.25/kWh), payback can happen in under three years. In Texas at $0.12/kWh, expect closer to eight to ten.

How long is the plug-in solar payback period, on average?
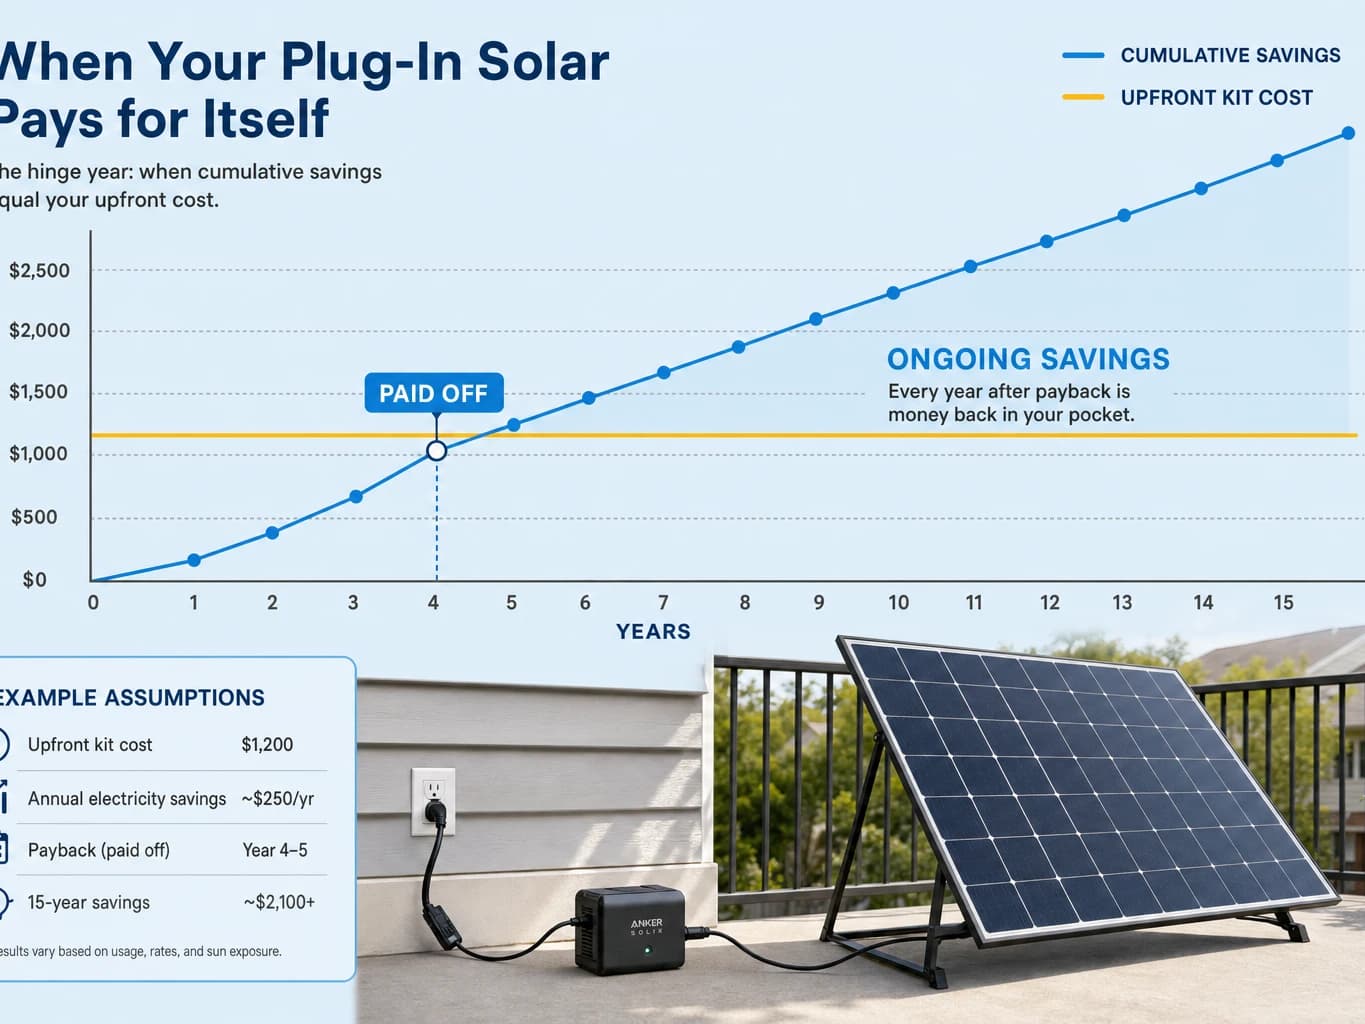
The plug-in solar payback period for a typical 800-watt system runs four to six years at national average electricity rates. A standard 800W kit costs $800–$1,500 upfront and saves you $150–$400 annually, depending on your local rate. Divide cost by annual savings—that's your payback.
The formula is simple: System Cost ÷ Annual Savings = Years to Payback
This is dramatically faster than rooftop solar, which typically takes seven to twelve years to break even, even before the federal tax credit expired at the end of 2025. Two variables drive nearly all the variation: your local electricity rate and what you paid for the system.
What determines your plug-in solar payback period?
Your electricity rate.
At the national average of $0.17–$0.18 per kWh (per EIA, Q4 2025), an 800-watt system saves roughly $155–$170 per year. At California rates ($0.25/kWh), that same system saves around $240. In Hawaii at $0.38/kWh, you're looking at $360 annually. Same panels, different utility bill. Your rate determines how much each kilowatt-hour of solar production is worth to you. Check your state's electricity rates and plug-in solar rules.
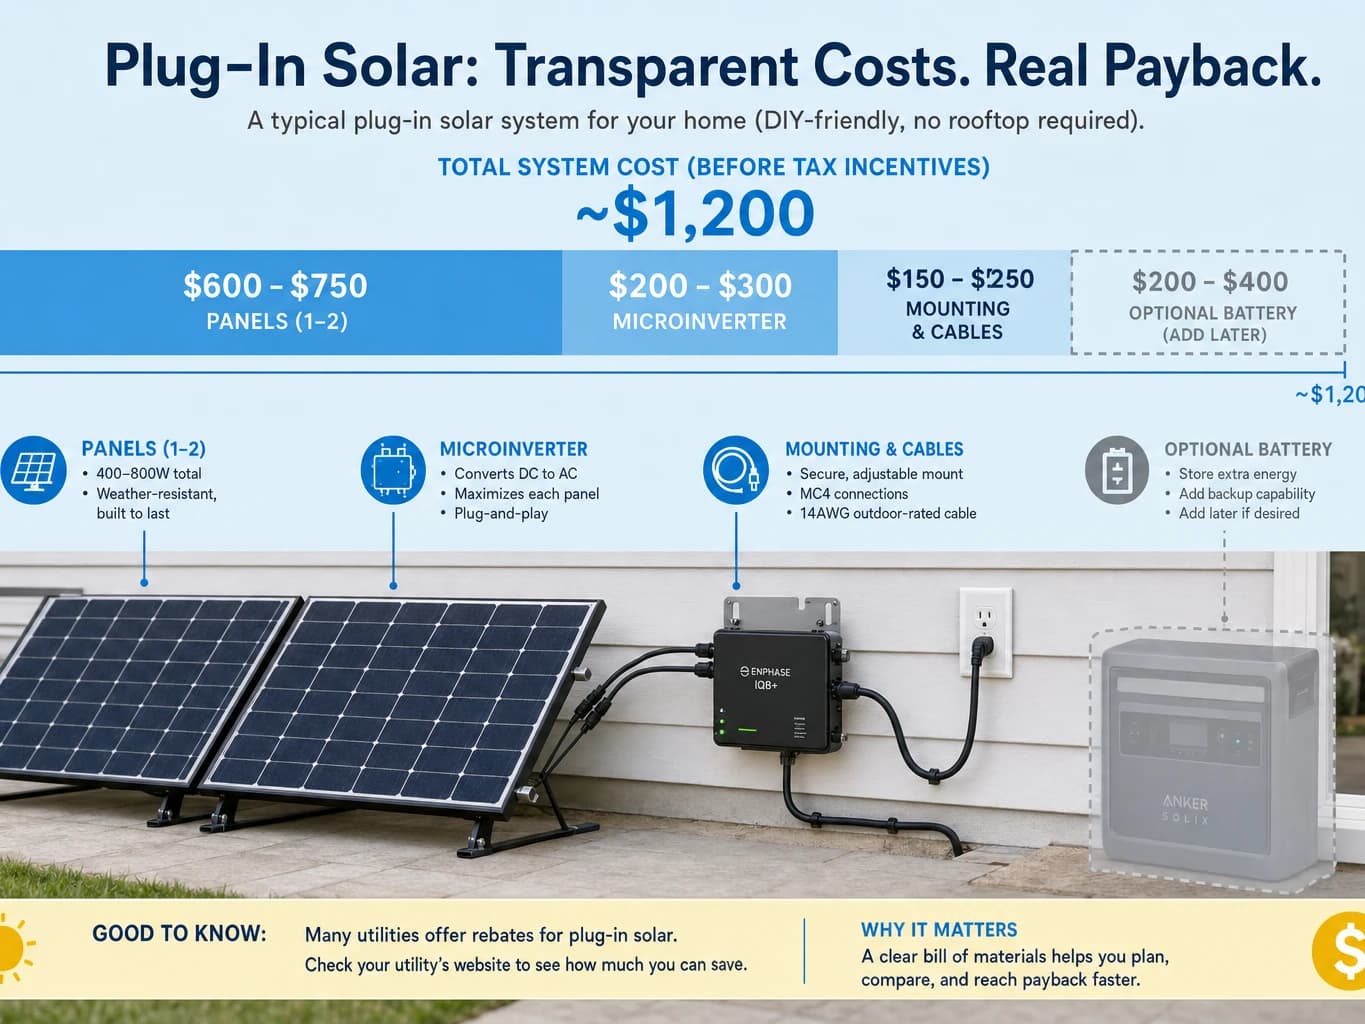
System cost.
A small 400-watt system without battery storage runs $300–$600. A full 1,200-watt system with battery might cost $2,000–$3,000. This is the numerator in your payback calculation—the higher it is, the longer you wait.
Annual electricity production.
A 400-watt system produces roughly 475 kWh per year in a sunny location. An 800-watt system produces about 950 kWh per year. The exact number depends on peak sun hours at your location. Estimate your location's production with our savings calculator.
DIY vs. professional installation.
If you install the system yourself (it's genuinely plug-and-play), you save $200–$400 and cut two to three months off your timeline. If you need an electrician, add that cost to your upfront total.
How does your plug-in solar payback period vary by state?
These examples assume a standard 800-watt system costing $1,200 and average sunlight hours for each state.
| State | Electricity Rate | Annual Savings | System Cost | Payback |
|---|---|---|---|---|
| California | $0.25/kWh | ~$400/yr | $1,200 | ~3 years |
| New York | $0.20/kWh | ~$220/yr | $1,200 | ~5.5 years |
| Utah | $0.13/kWh | ~$180/yr | $1,200 | ~6.7 years |
| Texas | $0.12/kWh | ~$140/yr | $1,200 | ~8.6 years |
Even in Texas—one of the cheapest electricity markets in the country—plug-in solar still breaks even before a rooftop system would. Check your state's plug-in solar regulations to estimate your specific payback timeline.
How does payback compare to rooftop solar?
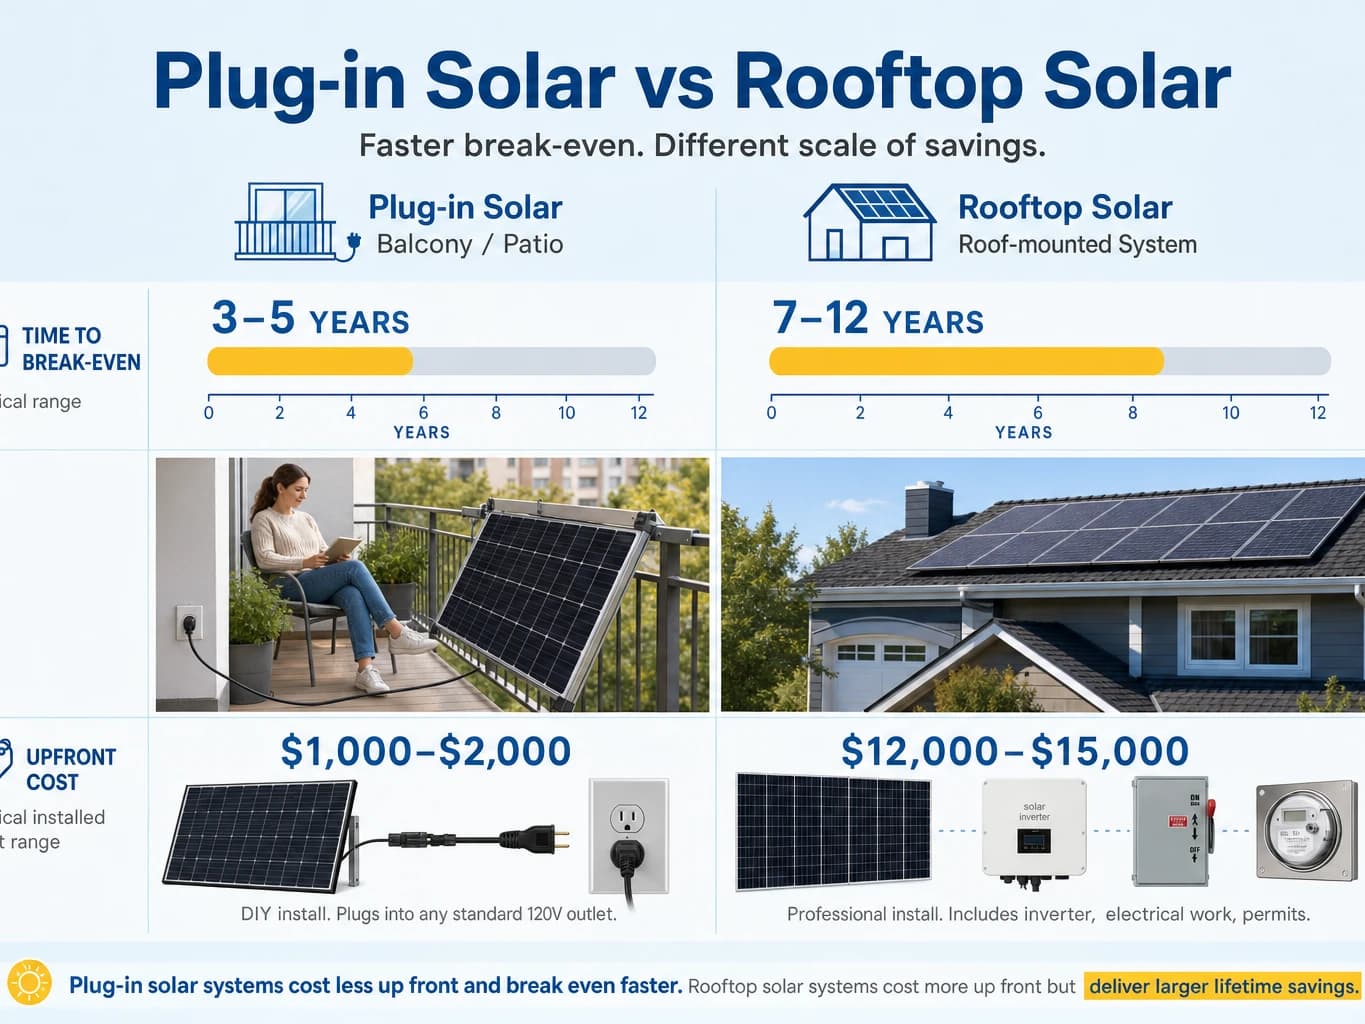
Rooftop solar takes longer to pay for itself but saves more money overall. A typical 5-kilowatt rooftop system costs $12,000–$15,000 and pays for itself in 7–12 years. Here's how the two options compare on the numbers that matter.
| Plug-In Solar | Rooftop Solar | |
|---|---|---|
| Upfront cost | $1,000–$2,000 | $12,000–$15,000 |
| Typical system size | 400W–1,200W | 5,000W (5kW) |
| Annual savings | $150–$400 | $1,000–$2,500 |
| Payback period | 3–5 years | 7–12 years |
| Requires roof access | No | Yes |
| Permits required | Usually not | Always |
| Portable | Yes | No |
Why choose plug-in if rooftop saves more over time? You might not own or control your roof. Renters, co-op boards, and condo restrictions make rooftop installations impossible for millions of Americans. Faster payback also means you feel the financial benefit sooner. And you can take the system with you when you move.
Real-world payback scenarios
Here's how the math plays out for three different buyers. Ready to run your own numbers? Browse our curated plug-and-play solar kits, organized by system size and use case — including balcony solar panels suited to apartments and small backyards.
Scenario 1: Renter in California
- System
- 800W, $1,200
- Location
- Los Angeles (300+ peak sun hrs/yr)
- Electricity rate
- $0.25/kWh
- Annual production
- 950 kWh
- Annual savings
- $238
- Payback
- 5 years
- After year 5
- ~$4,750 net savings by year 25
Scenario 2: Apartment dweller in Colorado
- System
- 600W with battery, $1,400
- Location
- Denver (280+ peak sun hrs/yr)
- Electricity rate
- $0.13/kWh
- Annual production
- 710 kWh
- Annual savings
- $92
- Payback
- 15.2 years
The $800 battery more than doubled payback. Batteries provide resilience during outages but zero additional bill savings.
Scenario 3: Homeowner in Maryland
- System
- 400W, $500
- Location
- Baltimore (250+ peak sun hrs/yr)
- Electricity rate
- $0.15/kWh
- Annual production
- 475 kWh
- Annual savings
- $71
- Payback
- 7 years
- After 7 years
- Minimal maintenance; microinverter warranty 10–15 yrs
What affects payback: costs you can't ignore
The upfront cost of plug-in solar is lower than rooftop in part because you're skipping several expenses.
No permitting fees.
Most jurisdictions don’t require permits for outlet-connected solar. Rooftop systems often need structural engineering, electrical permits, and inspections, adding $500–$2,000 to your cost.
No electrician required (usually).
Plug-in solar is literally plug-and-play. You can install it yourself in under an hour. Rooftop solar requires a licensed electrician and multiple days of work, easily $3,000–$5,000 in labor.
No roof reinforcement.
Rooftop systems need structural assessment and possibly reinforcement. Plug-in systems sit on a railing or ground mount. No structural load on your building.
No federal tax credits (but never qualified anyway).
The 30% federal residential solar tax credit expired December 31, 2025, for new rooftop installations. Plug-in solar never qualified for this credit. In that sense, 2026 leveled the playing field.
What does factor into your cost: the microinverter (the component that converts DC to AC electricity), cabling, battery if you choose it, and mounting hardware. For an entry-level 400-watt system, these run $300–$600 total. For a premium 1,200-watt system with battery, expect $1,800–$2,500.
What happens after your system pays for itself?
After year 5 on a standard 800W system in Denver, you're generating roughly 95 kWh per month at zero cost. At $0.13/kWh, that's $12 in electricity you're not buying—every month, for another 15–20 years. In California, the same production is worth $24/month.
Panel lifespan: 25–30 years. Panels degrade at about 0.5% per year, so your 800-watt system still produces around 780 watts at year 20. They don't fail abruptly; they gradually become less efficient.
Microinverter lifespan: 10–15 years typical. If yours fails after year 6, replacement costs $300–$400.
Lifetime savings: A $1,200 system that saves you $200/year breaks even at 6 years. From year 7 through year 25, that is 19 years × $200 = $3,800 in net savings from a $1,200 investment. Your solar panel ROI improves every year after payback. Our how-it-works guide covers the full production chain from sunlight to bill savings.
Common payback calculation mistakes
- 1
Counting incentives that don’t exist.
Plug-in solar never qualified for federal tax credits. Some states are considering rebates, but they’re not yet in place as of April 2026. Don’t assume a $300 state rebate unless it’s already law in your state.
- 2
Using outdated electricity rates.
Your utility’s rates increase 3–5% per year on average. Use your current rate for payback estimates, but know that your actual payback will be faster as rates climb.
- 3
Forgetting that payback varies by season.
A system in California gets sun 350+ days a year. A system in the Pacific Northwest gets useful sun maybe 200 days. Your sunlight hours directly affect annual production. Use site-specific irradiance data.
- 4
Assuming battery storage shortens payback.
Batteries are great for resilience during outages. They’re bad for ROI. A $800 battery can add 4–5 years to payback with zero additional bill savings.
- 5
Not accounting for DIY vs. professional installation.
Installing plug-in solar yourself saves $200–$400 in labor. If you’re comfortable with basic electrical safety, DIY cuts 1–2 years off your payback. If you need an electrician, add that cost to your upfront total.
Want a precise estimate for your location? Our savings calculator pulls NREL production data for your exact location to give you a real plug-in solar payback period estimate. Check whether permits are required in your area before you buy.
Frequently Asked Questions
Common questions about plug-in solar payback and return on investment.
Ready to see your plug-in solar payback period?
Enter your zip code and monthly electricity bill. Our calculator uses real solar production data for your location to estimate your break-even date.
Last updated: April 26, 2026. Electricity rates and incentive information reviewed quarterly for accuracy.